

Creating a spreadsheet risk assessment model is one of the key components in establishing a successful spreadsheet remediation program. The risk assessment model must encompass all aspects of risk that spreadsheets present to an organization. Read on to learn how to create a risk assessment model, with examples included.
This is an excerpt from Apparity’s Spreadsheet Remediation Guide. The guide is focused on risk assessment of spreadsheets, but naturally extends to other end user computing (EUC) applications as well.
- Identify when a spreadsheet requires remediation.
- Determine whether remediation efforts are sufficient.
- Monitor the spreadsheet population for significant changes that require adjustments to controls.
Spreadsheets must be examined both quantitatively and qualitatively. Quantitative evaluation determines complexity. Qualitative evaluation establishes materiality.
The complexity and the materiality of an application are the two main contributors to risk. The more complex a spreadsheet, the greater the possibility of one or more of the controls failing. Failures can incur financial, reputational, or operational damage, thus the materiality of such a failure.
Stage 1: Understand what Complexity and Materiality means to the organization
Spreadsheet Complexity
Complexity can typically be measured systematically. In its most basic form, a spreadsheet with low complexity would have no formulae or links. For example, a spreadsheet may only be used for information logging and tracking. Medium complexity is where simple formulae are used, for example to transform or reformat information.
The remaining spreadsheets would be classified as high complexity. High complexity spreadsheets use complex formulae and/ or include links to external sources, macros, and modelling. Moreover, the more complex an application is the less likely someone other than the developer and/ or owner can understand it. Therefore it presents greater spreadsheet risk.
Spreadsheet Materiality
Typical materiality impact classifications include, but are not limited to:
- Business process disruption
- Deficient or inadequate customer (internal and external) outcomes
- Decline in customer (internal and external) confidence
- Reputational damage
- Financial losses from existing business and loss of potential new business
- Regulatory sanctions
Using the above classifications provides a starting point in defining and ranking materiality. A typical ranking would be:
- High: The application supports financial reporting, regulatory reporting, includes private data, or confidential information.
- Medium: The application supports reporting, calculations, inputs into a core management information system, or is used for making key business decisions.
- Low: The application supports internal operations, day to day decisions, or contains outputs from core management information systems.
Levels of Control
By establishing a spreadsheet’s complexity and materiality, the appropriate degrees of control can now be defined. The higher the complexity and materiality rating, the greater the requirement for effective and well evidenced controls.
The following illustration shows the relationship between complexity, materiality, and the level of required remediation and oversight. The four color bands indicate ascending levels of risk and remediation efforts ranging from blue (none) to red (significant).
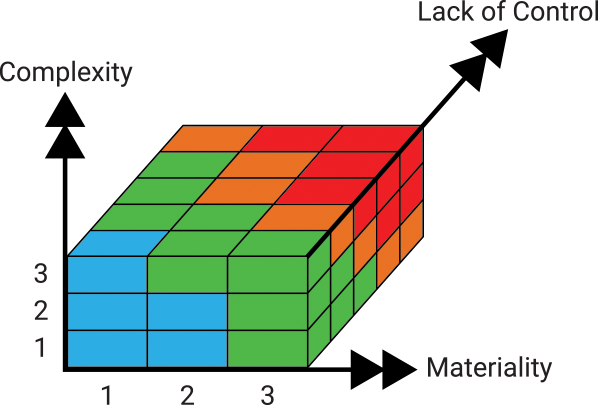
Complexity, materiality & control metrics: The degree of control and oversight is illustrated using the concept of the cube’s three dimensions. Control is determined by the values assigned to a spreadsheet’s complexity and materiality.
Stage 2: Building a spreadsheet risk assessment model
The spreadsheet risk assessment model will be similar for most organizations. The similarities will be around the measures of complexity and materiality. However, the processes and discrete steps involved in risk scoring and degree of oversight will vary.
With best practice in mind, the approach described below will reflect one of the more complex approaches. This approach reflects the commonality of metrics and measures. Risk scoring can be linked to controls via inherent risk calculations and residual risk as a barometer of action.
Quantitative + Qualitative = Effective Risk Assessment
Risk assessment is a combination quantitative system generated data points (complexity) and the answers to a series of qualitative questions (materiality). These measures of risk, when scored, can then be aligned with spreadsheet management policy. This enables an organization to build a robust and sustainable spreadsheet risk assessment model.
The risk assessment model provides the basis to further evaluate a spreadsheet’s inherent risk and residual risk.
Materiality + Complexity = Control
Materiality is measured when a common set of impact types, as outlined earlier, are each scored. Examples include integrity, confidentiality, and availability.
This approach ensures an organization can apply a consistent and comprehensive measure of a spreadsheet’s inherent risk. The inherent risk scoring allows identification of the controls needed to manage that risk (by impact within type). It also helps determine whether the resultant controls are effective.
This approach to measuring materiality, combined with systematic complexity scoring, allows an organization to assess a spreadsheet’s residual risk.
Control + Audit Cycles = Effective Spreadsheet Remediation
The risk assessment model and controls are meaningless unless the organization can monitor, remediate, and affirm their effectiveness. The efficacy and success of the risk assessment model and the organization’s spreadsheet remediation program are inexplicably linked.
Stage 3: Align the spreadsheet risk assessment model to the business
Not every spreadsheet needs to be assessed
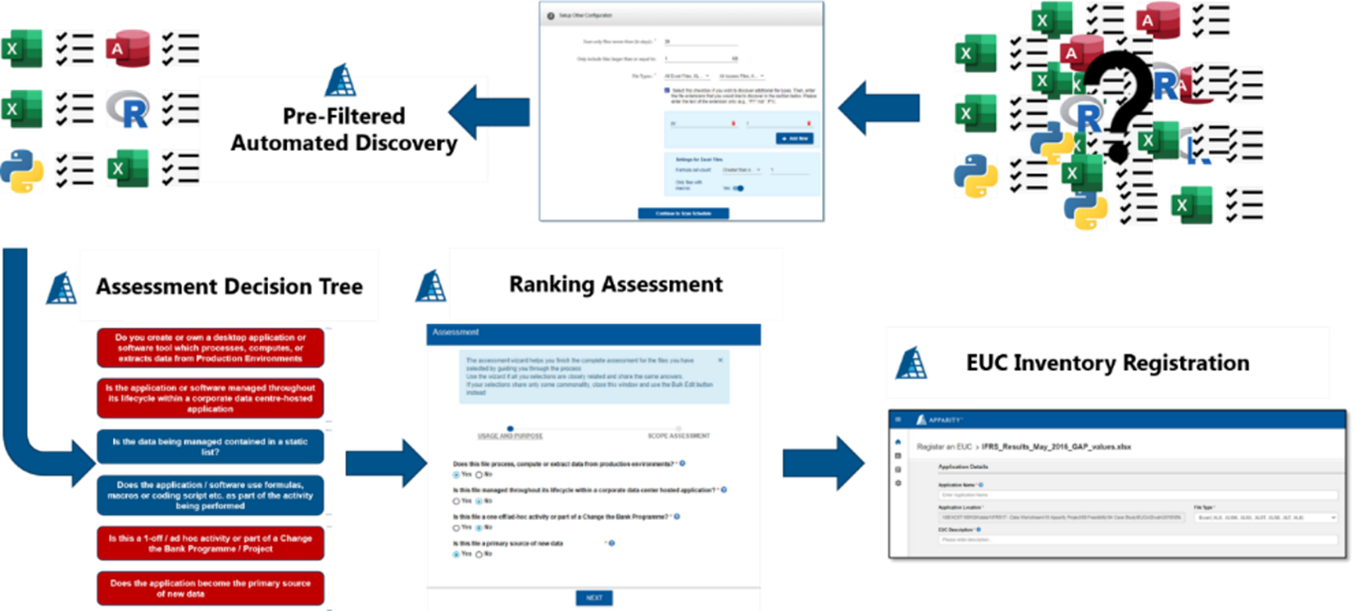
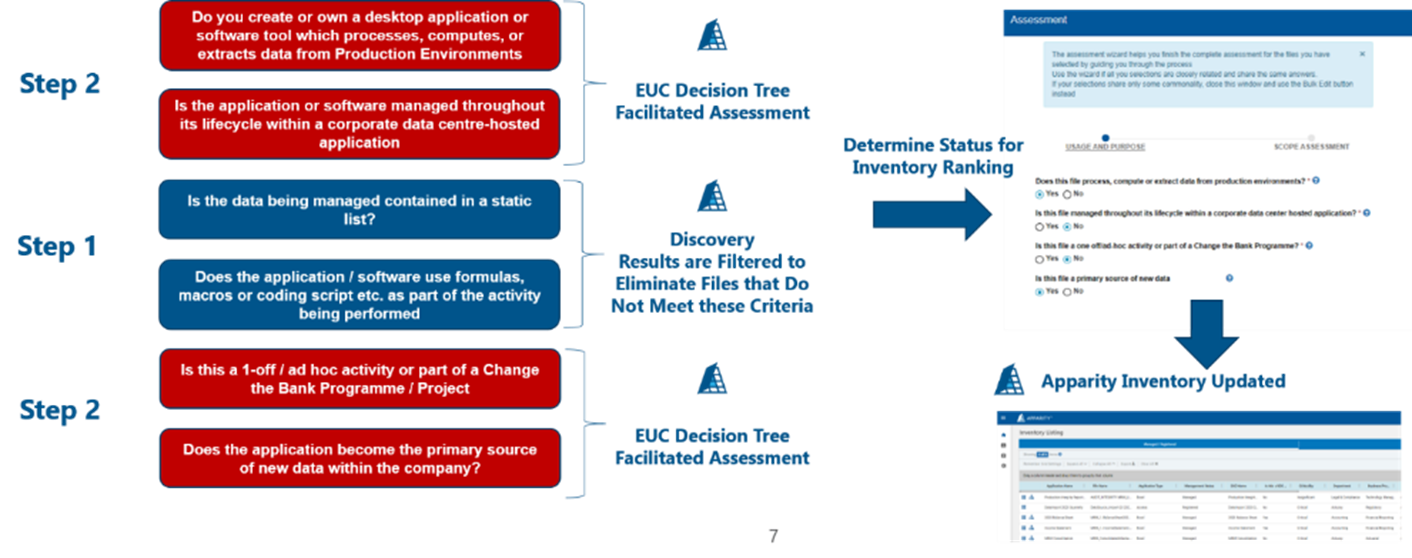
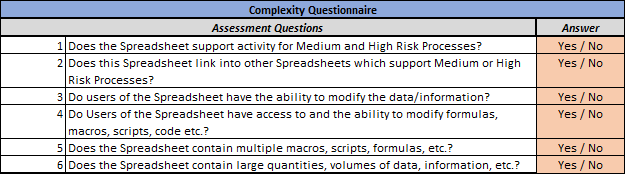
The sheer volume of spreadsheets revealed through the discovery process can be overwhelming. The organization must define a mechanism for eliminating spreadsheets that do not need to be assessed. This can be achieved through a brief but effective set of questions. The questionnaire can be answered systematically or by using a combination of system generated metrics and evaluation questions.
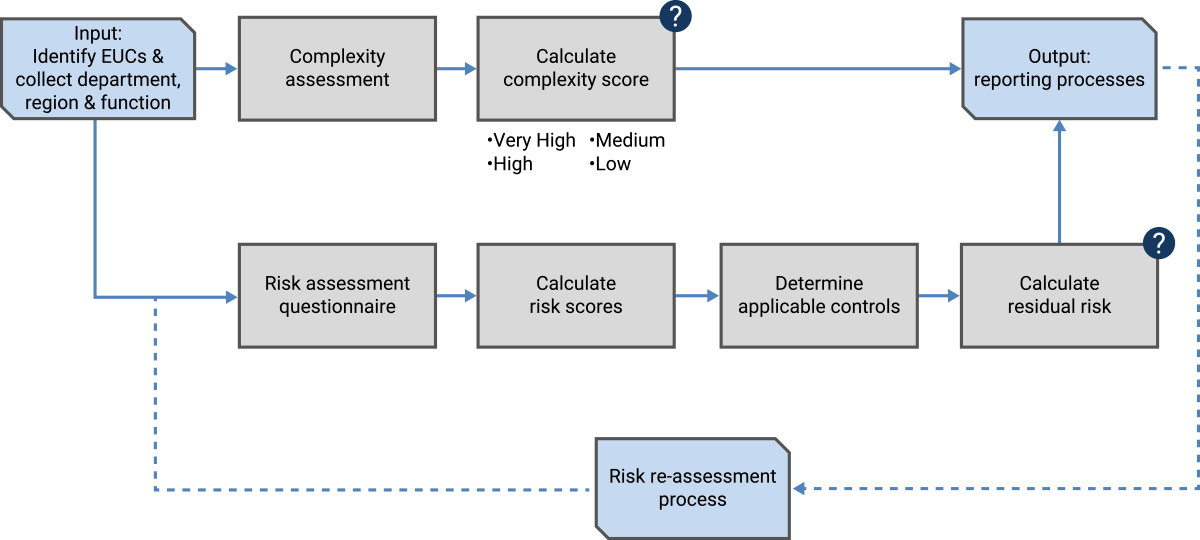
Complete flow of events from discovery to inventory registration.
Flow comprised of system-based filters and end user/ subject matter expert answers to questionnaire. These help assess whether the spreadsheet should be considered a risk and then assessed.
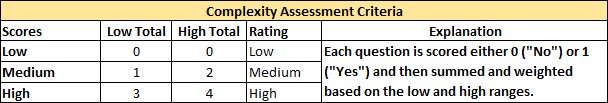
Determine spreadsheet complexity and generate a complexity score
With the assessment ‘triage’ in place, an organization can now assess the complexity of the spreadsheet. At this stage, most companies draw upon the internal stakeholders and experts to agree upon a complexity assessment algorithm.
In the past, these questions have typically been limited to:
- Business processes the spreadsheet directly supports
- Ability to modify spreadsheet’s data
- Support for ‘linked’ processes
- Inclusion of PII
- Macro usage
However, regulators have recently begun focusing far greater attention on data lineage. This extends to the data integrity of the spreadsheet’s production versions. Best practice is to now factor in linked files, from an input and output perspective. Moreover, data lineage maps should include every subsequent link (linked source(s) of a linked source).
The data lineage map below illustrates a common occurrence. More spreadsheets are pulling and pushing data from multiple sources and file types many layers deep. This increases the inherent complexity of the spreadsheet significantly.

In this regard, the complexity assessment scoring table needs to be updated to include the results of a separate scoring model. This additional scoring model must assign a complexity weight based on the risk encompassing the spreadsheet and all its linked sources.
In short, the inventory record for each spreadsheet should include all the factors mentioned above. The inventory illustration below shows typical complexity factors, including external link counts. In this example, when link count is factored in, all the inventoried spreadsheets are classified as high complexity.

Determine what the materiality assessment questionnaire includes
As described earlier, materiality is defined as the impact resulting from a failure of controls. Using a materiality assessment questionnaire helps measure the inherent risk a spreadsheet presents. Once answered, the responses should be converted into a scoring system. The scoring system will determine the control groups and control types that need to be applied to each spreadsheet.
In the following example, each control group is assigned to a 3R risk category of readiness, responsibility, and reliability.
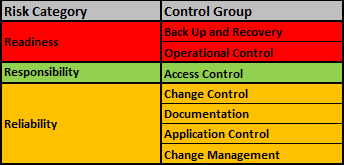
The sample questions below, grouped by 3R risk category, are taken from several global banking and financial services companies. This should not be considered a definitive list, but rather a starting point in developing an organization-specific list.

As with the complexity scoring methodology, the materiality assessment questionnaire also needs to be scored. Similarly, the organization should base this on their own view of present and future vulnerabilities. Vulnerability scope should consider the maturity and effectiveness of the systems that support each control group.
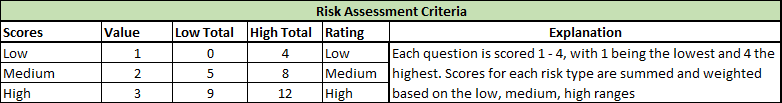
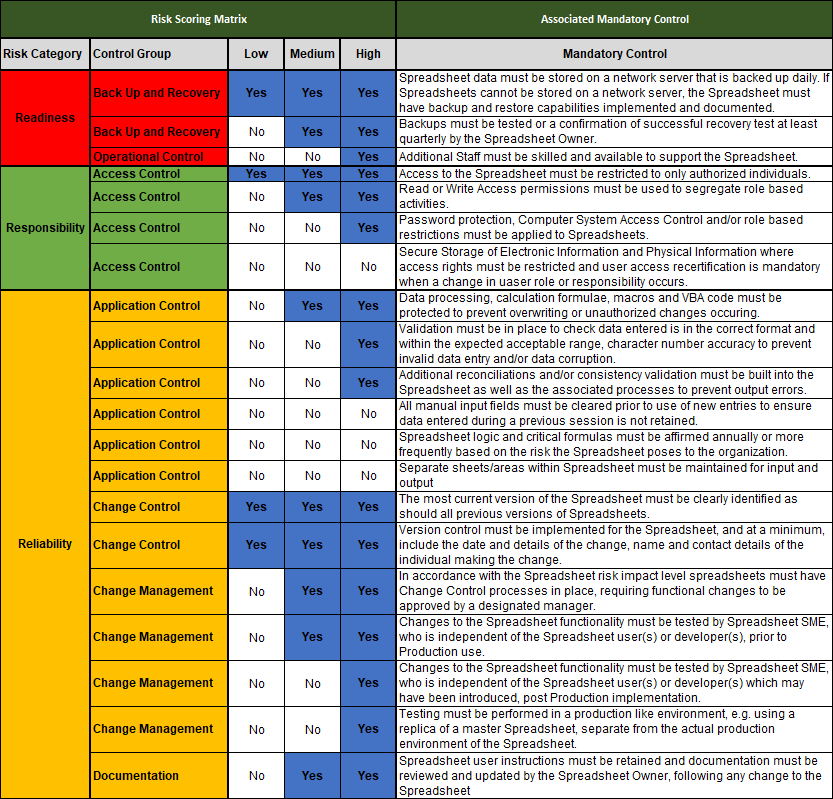
Once the scoring algorithm is in place, mandatory controls can be aligned to a control group and 3R risk category. Now the results of the materiality assessment can be systematically applied to determine the controls for each spreadsheet.
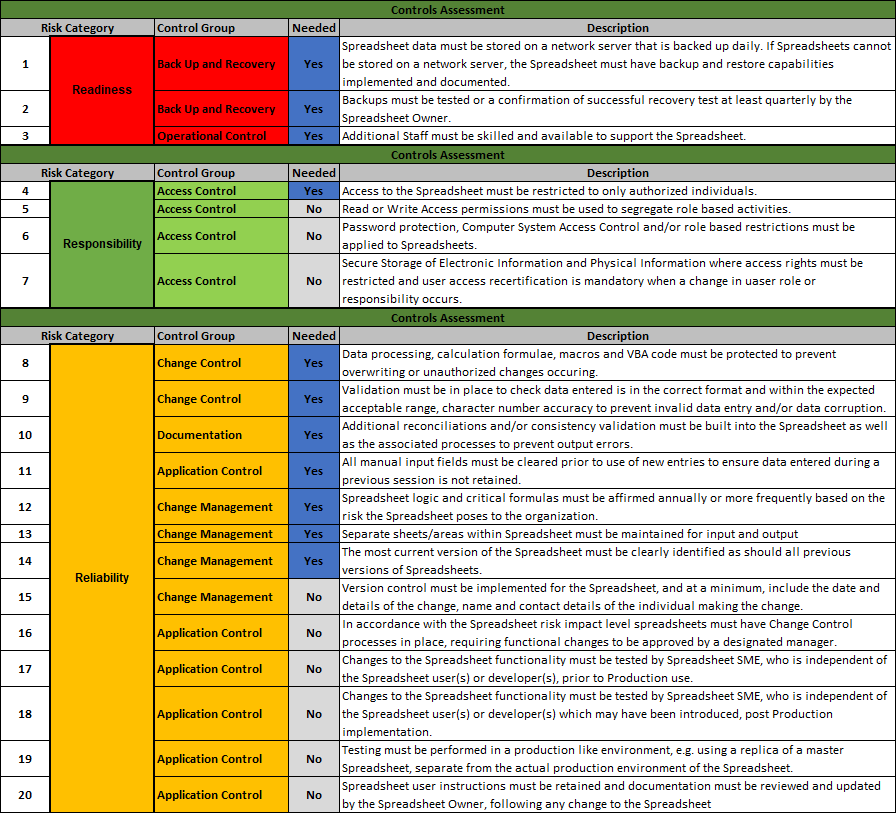
Controls assessment based on scoring system shown earlier.

Spreadsheet Remediation Guide
A risk assessment model is just one of the key elements of a spreadsheet remediation program. Learn what else it takes to launch a successful remediation program with this free guide.